World Happiness in 2018
April 23, 2018
My
maternal grandmother, who was born on a
farm near
Kamienna, Poland, in 1895, was a great source of
Polish folk wisdom. I mentioned her last year in an
article (Walking in the Rain, September 4, 2017) about a
computer simulation. One Polish
adage that I learned from her is this - "You can always tell a
crazy person by the way he
laughs."

My maternal grandmother was born in 1895, almost a decade before the Wright brothers made their first flight on December 17, 1903.
She lived to see Neil Armstrong walk on the Moon on July 21, 1969.
She journeyed to the United States on an early voyage of the RMS Lusitania, a ship that later became a part of World War I history.
Aside from a few crazed individuals, people laugh when they're
happy. While we suppose that the heartier laughers are happier than the rest of us, how much happier is that? As I wrote in an
earlier article (The Happiness Equation, July 25, 2016),
scientists have been making efforts to
quantify happiness. In the past, happiness was not easy to quantify, and it was more a topic of the occasional happiness
quizzes in the
Sunday supplement than a topic for scientific study.
Ubiquitous computing has now given us better tools with which we might quantify happiness.
Since many
words in our
language can be classified as either
happy or
sad, a 2011 study looked at the
frequency of occurrence of
happy and
sad words on
Twitter.[1] Fortunately, this study was conducted long before the
tweet storms engendered by the
2016 US presidential election. The
anecdotal validity of this approach is illustrated in the following
graph, which shows the analyzed change in happiness over the course of a
week. Only a
workaholic would question the idea that
weekends should be a happier time than
work days.
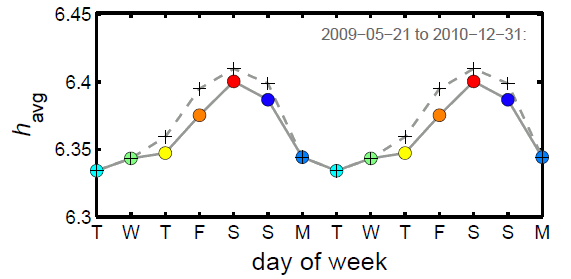 Happiness throughout the week (Fig. 5 from Ref. 1), licensed under the Creative Commons Attribution License.
Each year the
United Nations Sustainable Development Solutions Network publishes a
World Happiness Report that includes a happiness ranking of the world's
countries. This year's report was authored by
John F. Helliwell of the
Vancouver School of Economics at the
University of British Columbia,
Richard Layard of the
London School of Economics and Political Science, and
Jeffrey D. Sachs,
Director of the
Center for Sustainable Development at
Columbia University.[2-4]
Finland ranked first in world happiness in the 2018 report. The United States fell to 18th place from 14th place in the 2017 report.
here's a short list of the top twenty and lower twenty countries. These data were extracted from fig. 2.2 of ref. 2, and they show the ranking of happiness in the survey period, 2015-2017.[2]
So, how does this study quantify happiness? As for most such studies, it's done through a
survey. The country rankings are based on the
Gallup World Poll surveys for the years, 2015-2017.[2] The study participants, more than 1,000 in each country, were asked this simple,
subjective question,
"Imagine a ladder, with steps numbered from 0 at the bottom to 10 at the top. The top of the ladder represents the best possible life for you and the bottom of the ladder represents the worst possible life for you. On which step of the ladder would you say you personally feel you stand at this time?"
This is called a
Cantril ladder. A thousand people from each country were typically sampled in each year, so the happiness index for each country over the three year period was optimally based on 3,000 people, although
data for some countries were lacking.[2] A
sample size of 3,000 gives a fairly good 95%
confidence interval.[2] The average score ranged from 7.6 for Finland to 2.9 for Burundi.[3]
The differences between the top countries are small enough that that year-to-year changes in the rankings are expected.[2]
Nordic countries are regularly in the top five, while countries at
war and some
sub-Saharan Africa countries rank regularly as the bottom five.[3] Togo, which was in last place since 2015, showed an increase in valuation of 1.2/10 points, while
Venezuela dropped 2.2/10 points.[2]
What engenders happiness? The happiest countries tend to have high values for
economic strength (measured in
gross domestic product per capita),
healthy life expectancy,
social support,
freedom of choice,
trust, and
generosity.[2-3] The United States fell to 18th place from 14th in the 2017 report and 11th in 2012, the year of the first World Happiness Report, and it has never been in the top ten.[4]
Several reasons for the falling position of the US were noted in the report, and these included "a complex and worsening
public health crisis, involving...
obesity,
opioid addiction and
major depressive disorder," and
income inequality.[4] Income inequality was a major reason for unhappiness in the US, and it isn't present to such a great extent in other countries with similarly high-income levels.[4]
As the survey shows, the
grass can be greener on the other side of the fence. The ranking of countries by their
immigrant populations is almost exactly the same as for their
native population. Finland is first ranked by both populations.[2] Finland has a population of about 5.5 million, 300,000 of whom were immigrants in 2016.[4] John Helliwell, an editor of the 2018 World Happiness Report, is quoted by the
Voice of America as saying, "Those who move to happier countries gain, while those who move to less happy countries lose."[4]
There's a saying that
money can't buy happiness, and there appears to be evidence of this in the
Easterlin Paradox. This
paradox is that the per capita gross domestic product in the US has more than doubled since 1972 while happiness has been roughly stagnant with some declines (see graph). It appears that certain non-income determinants of happiness in the US are worsening as the per capita income has risen. Helliwell has associated this paradox with the five factors cited above; namely, population health (measured by health-adjusted life expectancy), the strength of social support networks, personal freedom, social trust (measured by the public's perception of government and business
corruption), and generosity.[2]
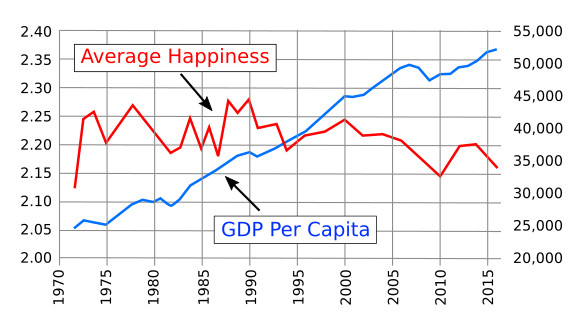
Graph of the Easterlin Paradox. The per capita gross domestic product (GDP) has been increasing since 1972 while happiness (subjective well-being) has been stagnant and in frequent decline. (Data from fig. 7.1 of ref. 2, created using Inkscape. Click for larger image.)
References:
- Peter Sheridan Dodds, Kameron Decker Harris, Isabel M. Kloumann, Catherine A. Bliss and Christopher M. Danforth, "Temporal patterns of happiness and information in a global social network: Hedonometrics and Twitter," PLoS ONE, vol. 6, no. 12 (December 7, 2011), Article no. e26752, doi:10.1371/journal.pone.0026752. This article appears, also, on arXiv.
- John F. Helliwell, Richard Layard, and Jeffrey D. Sachs, World Happiness Report 2018, UN Sustainable Development Solutions Network (New York, 2018), ISBN 978-0-9968513-6-7.
- Happiness report: Finland is world's 'happiest country' - UN, BBC News, March 15, 2018.
- Ashley Thompson, "Finland Named World’s Happiest Country, Voice of America, March 14, 2018.
Linked Keywords: Grandparent; maternal grandmother; farm; Kamienna, Poland; Polish; folk wisdom; computer simulation; adage; insanity; crazy person; laughter; laugh; decade; Wright brothers; first flight on December 17, 1903; Neil Armstrong; walk on the Moon; United States; RMS Lusitania; ship; sinking of the RMS Lusitania; World War I history; happiness; happy; scientist; measurement; quantify; personality quiz; Sunday supplement; Ubiquitous computing; words; language; frequency of occurrence; Twitter; tweet; 2016 US presidential election; anecdotal evidence; Cartesian coordinate system; graph; week; workaholic; weekend; work day; Creative Commons Attribution License; United Nations Sustainable Development Solutions Network; World Happiness Report; country; countries; John F. Helliwell; Vancouver School of Economics; University of British Columbia; Richard Layard; London School of Economics and Political Science; Jeffrey D. Sachs; Director; Center for Sustainable Development; Columbia University; Finland; Sudan; Norway; Ukraine; Denmark; Togo; Iceland; Guinea; Switzerland; Lesotho; Netherlands; Angola; Canada; Madagascar; New Zealand; Zimbabwe; Sweden; Afghanistan; Australia; Botswana; Israel; Malawi; Austria; Haiti; Costa Rica; Liberia; Ireland; Syria; Germany; Rwanda; Belgium; Yemen; Luxembourg; Tanzania; United States; South Sudan; United Kingdom; Central African Republic; United Arab Emirates; Burundi; opinion poll; survey; Gallup World Poll; subjectivity; subjective; question; imagination; Imagine; ladder; Hadley Cantril; data; sample size; confidence interval; Nordic countries; war; sub-Saharan Africa countries; Venezuela; economy; economic; gross domestic product; health; healthy; life expectancy; social; freedom of choice; trust; generosity; public health; obesity; opioid use disorder; opioid addiction; major depressive disorder; economic inequality; income inequality; the grass is always greener on the other side; grass can be greener on the other side of the fence; immigration; immigrant; jus soli; native; Voice of America; money; Easterlin Paradox; paradox; corruption; Inkscape.