Radar Plots
December 9, 2010
Graphics are an extremely efficient way to convey
scientific information, as I wrote in a
previous article (Visualizing Science, November 9, 2010) about
scientific visualization. Plots are easy to generate and compare when the parameters are numerical. That's why there are so many x,y plots in
my published papers and the papers of others scientists. When you're comparing things based on categories, things become difficult. Sure, you can just generate
stacked bar charts, but the mind's ability to focus on one of multiple items in a chart of several categories breaks down when there are more than two items displayed.
One type of chart that might not be familiar to most scientists is the
radar plot. I was first introduced to this type of plot when I was doing a study of advanced
display technologies. If you're interested in just one display parameter, such as
brightness, it's easy to see which would be the best. But if you're fielding a product in which brightness is just one of many design parameters, it's hard to decide which display to use. Other display parameters include
lifetime,
refresh rate,
power consumption,
color purity,
resolution and
cost. In our case, we were most interested in which parameters needed improvement in each display technology, and how difficult it would be to improve these parameters. A radar plot was the best visual representation of these disparate parameters.
As an example of a radar plot, let's look at a particular
wine. This is
Tikalon Reserve, a wine made from grapes that have fallen from trucks passing through
my township while traveling between the vineyards of
Western New York and the
New York City markets. Characterizing wine is somewhat subjective, but it's been put on a more quantitative basis using the categories of the
Aroma Wheel developed by
Ann C. Noble, a retired professor of
Viticulture and
Enology from the
University of California, Davis. The basic categories, which are sub-divided further into different aromas, are listed below with commentary from Wikipedia.[1]
• Chemical - Includes aromas like sulfur and petroleum
• Pungent - Aromas like alcohol
• Oxidized - Aromas like acetaldehyde
• Microbiological - Aromas like yeast and lactic acid
• Floral - Aromas like Pelargonium geraniums and linalool
• Spicy - Aromas like licorice and anise
• Fruity - Aromas like blackcurrant and apricot
• Vegetative - Aromas like eucalyptus and artichoke
• Nutty - Aromas like walnut and hazelnut
• Caramelized - Aromas like butterscotch and molasses
• Woody - Aromas often imparted by oak like vanilla and coffee
• Earthy - Aromas such as mushroom and mildew
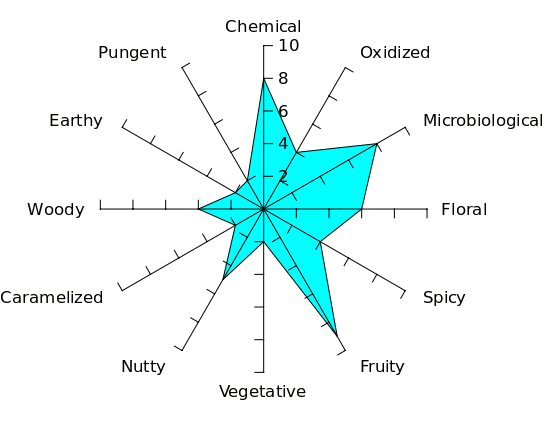
So, how does Tikalon Reserve rate as a wine? You can visualize it from the following radar plot that I generated using
Gnumeric.

Radar plot of aroma spectrum for Tikalon Reserve wine.
Once you find a wine you like, you need only to glance at a page full of such plots to decide what other wines you should try. You can see how radar plots are a great tool for discovery in some specialties.
I was reminded of radar plots when I read a recent paper in the
ACS journal,
Industrial & Engineering Chemistry Research, by researchers at the
Laboratory of Separation and Reaction Engineering,
University of Porto,
Porto, Portugal.[2-3] These engineers applied a methodology similar to the wine example, above, to
perfume.
Fragrance is at least as complicated and subjective as wine tasting, since a typical perfume consists of fifty to a hundred fragrance ingredients. Similar to the subjective wine aspects, fragrances are known by terms such as
floral,
citrus,
woody, and
oriental.[3] The names of the classifications vary depending of the origin, but there are usually just a handful. Perfume classification schemes have been codified by the French Society of Perfumers (1984; revised 1989) and others. One scheme, called
The Fragrance Wheel has 14 elements. The University of Porto group decided on the following for their fragrance radar scheme:
• Citrus
• Floral
• Green
• Fruity
• Herbaceous
• Musk
• Oriental
• Woody

Some fragrance radar examples can be found in their paper, which is available for free download at this writing.[2] The radar plots are not as complex as the wine example, above, since some combinations of fragrances on the list just wouldn't work together.
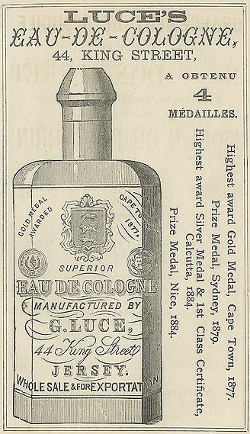
Advertisement for eau de Cologne from the almanac of La Nouvelle Chronique de Jersey 1891
![]()
References:
- The Aroma Wheel, Wikipedia.
- Miguel A. Teixeira, Oscar Rodrguez, and Alrio E. Rodrigues, "Perfumery Radar: A Predictive Tool for Perfume Family Classification," Ind. Eng. Chem. Res., vol. 49, no. 22 (2010), pp 11764-11777.
- Michael Bernstein, "'Perfumery radar' brings order to odors," American Chemical Society Press Release, December 2, 2010.
Permanent Link to this article
Linked Keywords: Graphics; scientific; scientific visualization; http://www.devgualtieri.com/; stacked bar charts; radar plot; display device; brightness; mean time between failures; refresh rate; power consumption; color gamut; color purity; display resolution; cost; wine; Roxbury Township, New Jersey; Western New York; New York City; Aroma Wheel; Ann C. Noble; Viticulture; Oenology; Enology; University of California, Davis; Gnumeric; American Chemical Society; ACS; Industrial & Engineering Chemistry Research; Laboratory of Separation and Reaction Engineering; University of Porto; Porto, Portugal; perfume; fragrance; The Fragrance Wheel; Almanach Nouvelle Chronique de Jersey 1891; eau de Cologne.