Methane and Global Warming
June 6, 2022
Many years ago, I was writing an article about
synthetic gems, so I accessed the Wikipedia page for jewelry. I was surprised to see that I had been redirected to a page for
jewellery. I had never heard this term, which is the
British English word for
jewelry.
Wikipedia's style manual allows articles to be submitted in either
American English or British English for general
topics, and jewelry/jewellery would fall into that
category. A
Google Search for jewelry gives 3,840,000,000 results, and a Google search for jewellery gives 2,940,000,000; so, the usage is about evenly split.
That incident reminded me of my
undergraduate chemistry course, which was taught by a
British chemist. His
classroom of
American teenagers found
humor in his
pronunciation of the
chemical compound,
methane. He pronounced it
meee-thane, using a
long vowel e rather than the
short vowel e with which we were familiar. In the
decades that have passed since that time in the
1960s, methane has become much more serious as one cause of
global warming.
One glance at the
infrared spectrum of
carbon dioxide, the principal cause of global warming, and that of methane shows the source of the problem. In each case, the infrared
radiation that the
Earth seeks to radiate after being
heated by
sunlight is not
transmitted back into
space. This is the
greenhouse effect, well known to even
elementary school students.
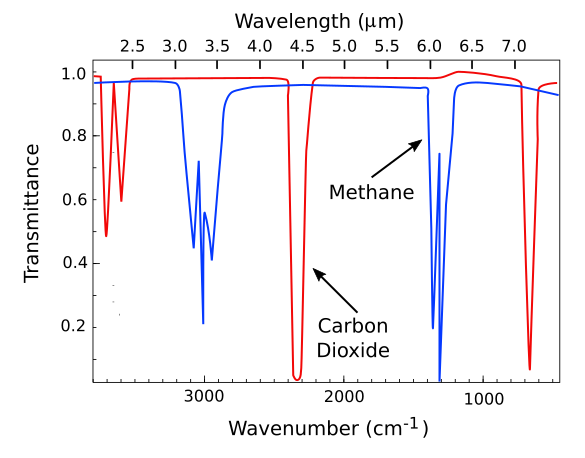
General features of the infrared transmittance of carbon dioxide and methane, as derived from various Internet sources and rendered using Inkscape. Higher resolution spectra can be found at refs. 1-2.[1-2]
Now, with all 2021
data analyzed, it's been found that the
concentration of
atmospheric methane set another record during 2021, as carbon dioxide levels also recorded a huge rise.[3-5] These data were from the
National Oceanic and Atmospheric_ dministration (NOAA) Mauna Loa observatory in
Hawaii.[3] Atmospheric methane increased by 17
parts per billion (ppb) in 2021, and this was the largest
annual increase since 1983 when data were first collected.[3]
This follows the 15.3 ppb increase in 2020.[3] The total atmospheric methane now stands at 1,895.7 ppb, which is about 162% greater than that of
pre-industrial levels.[3] Carbon dioxide at the end of 2021 stands at 414.7 parts per million (ppm), marking the tenth consecutive year that carbon dioxide increased by more than 2
parts per million.[3] NOAA also tabulates the annual global average levels of
nitrous oxide and
sulfur hexafluoride, two other
greenhouse gases.[3]
Global Annual Increase in Methane (CH4)
(Source: NOAA.[4])
| Year |
Annual
Increase (ppb) |
Year |
Annual
Increase (ppb) |
| 1984 |
12.82±0.84 |
2003 |
4.80±0.57 |
| 1985 |
12.31±0.91 |
2004 |
-4.89±0.42 |
| 1986 |
12.90±0.65 |
2005 |
0.38±0.41 |
| 1987 |
11.40±0.72 |
2006 |
1.94±0.56 |
| 1988 |
10.79±0.55 |
2007 |
7.79±0.57 |
| 1989 |
11.08±0.59 |
2008 |
6.53±0.44 |
| 1990 |
8.75±0.47 |
2009 |
4.70±0.41 |
| 1991 |
14.06±0.55 |
2010 |
5.19±0.71 |
| 1992 |
2.36±0.51 |
2011 |
4.83±0.58 |
| 1993 |
3.83±0.59 |
2012 |
5.01±0.51 |
| 1994 |
7.21±0.61 |
2013 |
5.70±0.58 |
| 1995 |
3.96±0.56 |
2014 |
12.77±0.50 |
| 1996 |
2.50±0.48 |
2015 |
10.02±0.70 |
| 1997 |
6.27±0.69 |
2016 |
7.09±0.67 |
| 1998 |
12.15±0.70 |
2017 |
6.85±0.79 |
| 1999 |
2.43±0.65 |
2018 |
8.67±0.52 |
| 2000 |
-1.52±0.54 |
2019 |
9.89±0.64 |
| 2001 |
-0.73±0.56 |
2020 |
15.27±0.38 |
| 2002 |
3.27±0.56 |
2021 |
16.99±0.38 |
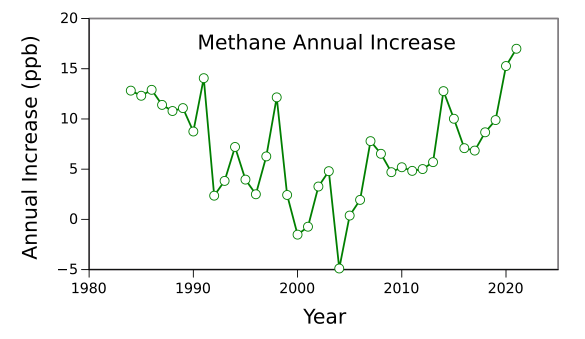
Global annual increase in atmospheric methane, graphed using Gnumeric from the table data above. (Click for larger image.)
Says NOAA
administrator,
Richard W. Spinrad,
"Our data show that global emissions continue to move in the wrong direction at a rapid pace... The evidence is consistent, alarming and undeniable. We need to build a Climate Ready Nation to adapt for what's already here and prepare for what's to come. At the same time, we can no longer afford to delay urgent and effective action needed to address the cause of the problem - greenhouse gas pollution."[3]
Last year,
humans emitted about 36 billion
tons of carbon dioxide, and 640 million tons of methane were emitted into the atmosphere. Methane is about 25 times more powerful a global warming agent than carbon dioxide; but, fortunately, the atmospheric
residence time of methane is approximately nine years, while the affect of carbon dioxide is considerably longer.[3] It's estimated that about 40% of the
Ford Model T emissions from 1911 are still in our atmosphere.[3] Today's atmospheric carbon dioxide level is about that of the
mid-Pliocene, 4.3 million years ago, when the average temperature was 7 degrees
Fahrenheit higher than that in pre-industrial times, and sea level was about 75 feet higher.[3]
Since the residence time of atmospheric methane is so short, reducing its emission will have a beneficial short-term impact on global warming. The largest methane source is
biological, coming from from
microbial emission in
wet,
anaerobic environments such as
swamps and other
wetland ecosystems.[5] Methane in smaller amounts is emitted from
enteric fermentation in
termites and
wild animals.[5]
Food production is a problem, also, since methane is a
byproduct of
digestion in
cows and other
ruminant animals.[5]
Animal waste and
landfills emit methane, also.[5]
Fossil fuel (both
coal and
oil) contributes about 30% of the total methane emission.[3] These methane sources are easy to pinpoint and control.[3] Methane also contributes to
ozone formation at ground-level, and this causes about 500,000
premature deaths globally each year.[3]
Through use of
carbon isotopic analysis, the NOAA found that biological sources of methane were a primary driver of methane increase after 2006, and this might indicate that a
feedback loop may have developed in which more
rain leads to increased methane release in
tropical wetlands.[3] Furthermore,
melting of
frozen soils and
permafrost in the
Arctic leads to increases in both atmospheric carbon dioxide and methane.[5] There are two NOAA
websites,
CarbonTracker-CO2 and
CarbonTracker-CH4, that provide updates on these atmospheric gases.[5-6]
CarbonTracker-CH4 column average CH4 for July-August, 2007. Warm colors show high concentrations, while cool colors show low concentrations. There are relatively large emissions from wetlands in Western Siberia and emissions from anthropogenic and natural sources in India and Asia, and the methane is moved by weather systems to form the patterns in this animation. (NOAA image.)
References:
- NIST Chemistry WebBook-Methane.
- NIST Chemistry WebBook-Carbon Dioxide.
- Increase in atmospheric methane set another record during 2021, National Oceanic and Atmospheric Administration, U.S. Department of Commerce, Press Release, April 7, 2022.
- Trends in Atmospheric Methane, Global CH4 Monthly Means, NOAA.
- CarbonTracker-CH4.
- CarbonTracker-CO2.
Linked Keywords: Chemical synthesis; synthetic; gemstone; gems; jewellery; British English; word; jewelry; Wikipedia's style manual; American English; topic; category; Google Search; undergraduate education; undergraduate; chemistry; course (education); United Kingdom; British; chemist; classroom; America; American; adolescence; teenager; humor; pronunciation; chemical compound; methane; vowel length; long vowel; short vowel; decade; 1960s; global warming; infrared; electromagnetic spectrum; carbon dioxide; electromagnetic radiation; Earth; heat; heated; sunlight; transmittance; transmitted; outer space; greenhouse effect; elementary school; student; Internet; Inkscape; spectral resolution; data analysis; concentration; atmosphere of Earth; atmospheric; National Oceanic and Atmospheric dministration (NOAA); Mauna Loa observatory; Hawaii (island); parts-per notation; parts per billion (ppb); year; annual; Industrial Revolution; pre-industrial; parts per million; nitrous oxide; sulfur hexafluoride; greenhouse gas; methane (CH4); global annual increase in atmospheric methane; Earth; global; year; annual; atmosphere of Earth; atmospheric; Cartesian coordinate system; graph; Gnumeric; business administration; administrator; Richard W. Spinrad; emission; air pollution; Human; ton; residence time; Ford Model T; mid-Pliocene; Fahrenheit; biology; biological; microorganism; microbial; wetland; wet; anaerobic organism; environment (biophysical); swamp; ecosystem; gut flora; enteric; fermentation; termite; wildlife; wild animal; food industry; food production; byproduct; digestion; cattle; cow; ruminant animal; manure; animal waste; landfill; fossil fuel; coal; petroleum; oil; ozone formation at ground-level; premature death; isotopes of carbon; carbon isotopic analysis; feedback loop; rain; tropics; tropica; melting; freezing; frozen; soil; permafrost; Arctic; website; CarbonTracker-CO2; CarbonTracker-CH4; plume (fluid dynamics); column; average; Western Siberia; human impact on the environment; anthropogenic; natural; India; Asia; weather; weather system; animation.