A Special Triangle Pair
June 1, 2020
When
scientists write for
publication, they're very careful with the
text. Multiple
drafts are circulated among
coauthors to ensure that all the results are included and nothing is ambiguous. There's also adherence to some questionable
style requirements such as writing in an
active voice, rather than a
passive voice. I've always preferred the passive voice and the
editorial we, but most
grammarians object to these.
Things are different when scientists read a paper. They ignore the text and go right to the
figures. The
adage, "
A picture is worth a thousand words," is as true today as a
century ago, as is the
logical consequence that "
1001 words is worth more than a picture."[1] Fortunately for
English speakers, most science is written in English, but papers in other
languages can be understood just by their figures.
There are multiple ways to present
data, some better than others.
Edward Tufte (b. 1942) is an acknowledged
expert in
informational graphics.[2] Tufte is also a
hero of
self-published authors, since he self-published a
commercially successful
book, "Visual Display," by taking out a
second mortgage on his
home. This was in 1982, before the self-publishing
boom caused by the
Internet. Today, self-published authors have a much lower
financial barrier. Tufte was an early critic of the way that
Microsoft PowerPoint is used to present
information at
meetings. Tufte prefers written
reports to
PowerPoint, but I still find PowerPoint (in my case,
LibreOffice Impress) to be effective.
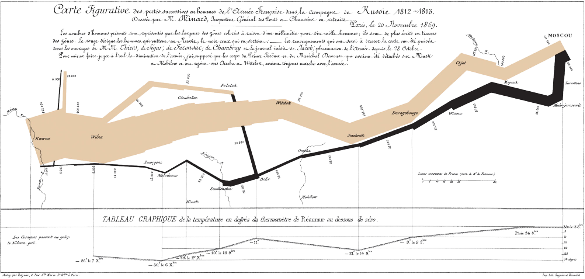
An 1869 chart by Charles Minard (1781-1870) depicting Napoleon's 1812 Russian Campaign. The majority of articles about informational graphics contain this figure. This chart combines data on the number of men in Napoleon's men, their movements, as well as the temperature they encountered on the return path. This chart quite effectively represents the army losses.(Via Wikimedia Commons. Click for larger image.)
I thought about information graphics when I was doing some
experimental mathematics on an interesting pair of
triangles. I was introduced to these triangles by a posting on
Evelyn Lamb's Roots of Unity blog.[3] She writes that there is only one pair of triangles, one
right triangle and one
isosceles triangle, that have
integer side length, equal
perimeters and equal
areas (see figure). Lamb gives some background on this problem, which relates to
algebraic geometry.[3]
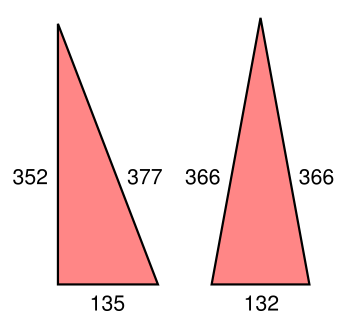
A right triangle and an isosceles triangle with the same perimeter and area.
In each case, the perimeter is 864, and the area is 23,760.
(Created using Inkscape)
I decided to examine the area of all triangles with the same perimeter
intermediate between these two triangles; that is, I examined all triangles with sides a = [132..135], b = [352..366], c = [366..377], selected those with perimeter 864, and calculated their areas. There are 46 triangles that meet the perimeter
criterion, and these were discovered with a simple
computer program (
source code here, and the resultant
data file here).
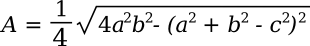
Finding the area is easy if you know the
height (
altitude) of the triangle, since the area is given by the
formula A = (1/2)bh in which b is the length of the
base, and h is the height. In this case, in which the height is unknown, it's easier to use
Heron's formula,

Where
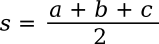
s, a
parameter known as the
semiperimeter, is half the
perimeter; viz.,
This
equation can be written in terms of the sides, only, as
As a first
visualization, I wrote a computer program that created an
SVG image of all the triangles (source code
here, and a required data file of
apex data is
here). Drawing the triangles required a
calculation of the positions of the three apices of each triangle. This was done using the
Gnumeric spreadsheet application. While two of these apices are
trivial, since they are at the ends of the base, one of them is at the top of the triangle altitude.
A little bit of
algebra using the
Pythagorean theorem found that
h2 = b2 - (a-x)2, and
h2 = c2 - x2, where
x is the location of the altitude on the base. Solving these equation for
x gives us the x-position and the y-position of the final apex, and it allowed generation of this figure.
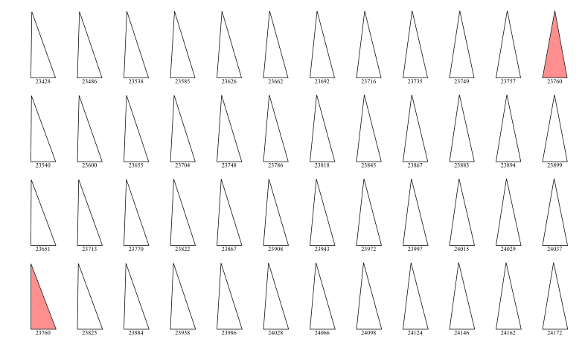
Triangles with a perimeter of 864 with sides in the range of a = [132..135], b = [352..366], and c = [366..377]. The special pair of triangles is shown in red. (Generated by a computer program, as explained in the text. Click for larger image.)
So, how does the area vary over these triangles? Although the data could be presented as a
table, the table would have 48 rows, and it would be difficult to discern any
patterns. That's why informational graphics are important. I tried various ways of
graphing the data, and I decided that the
column chart, shown below, is the most informative. It's also
aesthetically pleasing, and the pattern is reminiscent of the
reflectors of a
Yagi antenna.
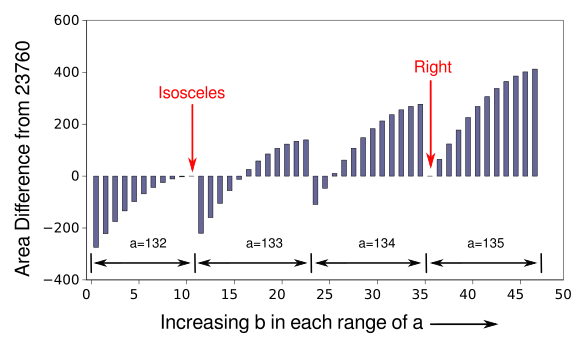
Column chart of the area data, as sorted in increasing a, then b, values. Since the differences in area are small with respect to the average area, the differences from the "ideal" area are shown. The locations of the isosceles and right triangles are shown. (Click for larger image.)
I tried several other graph types. The
radial and
surface graphs, shown below, don't provide as much information. The radial graph is interesting from an
artistic perspective, and it makes me wonder how much good art might be lurking in mathematical problems like this.
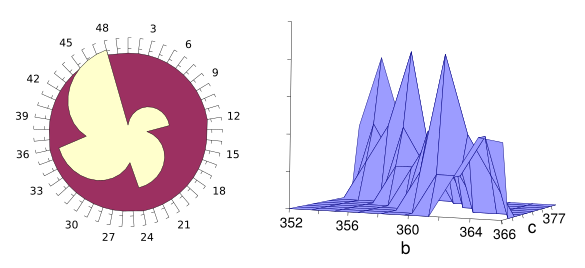
Like a dove. On the left is a radial plot of the area data, looking very much like a dove. On the left is a surface plot of the area in terms of side lengths b and c.
Mathematics has enriched art through such concepts as perspective, and many artists have created geometrical works. One example is Josef Albers (1888-1976), who created a series of paintings called "Homage to the Square." (Both plots rendered using Gnumeric.)
I decided to find how close a triangle could come to the area of an
equilateral triangle with sides 200 and perimeter 600. I checked all triangles with sides a = [180..220], b = [180..220], and c = [180..220]. A triangle with sides 188-211-203 comes within −0.000890% of the 17320.508076 area of the equilateral triangle. Alas, the perimeter of this triangle is 602.
References:
- The Sayings of John Mccarthy, archive.org. Also at a Stanford University website.
- The work of Edward Tufte and Graphics Press, edwardtufte.com website.
- Evelyn Lamb, "The Very Special Triangles," Roots of Unity at Scientific American, March 6, 2020.
Linked Keywords: Scientist; scientific literature; publication; written language; text; draft document; author; coauthor; style guide; style requirement; active voice; passive voice; editorial we; grammar; grammarian; drawing; figure; adage; A picture is worth a thousand words; century; logical consequence; 1001 words is worth more than a picture; English language; language; data; Edward Tufte (b. 1942); expert; informational graphics; hero; self-publishing; self-published; commerce; commercial; book; second mortgage; home; business cycle; boom; Internet; finance; financial; barricade; barrier; Microsoft PowerPoint; information; meeting; report; LibreOffice Impress; Charles Minard's 1869 chart of Napoleon's 1812 Russian Campaign; chart; Charles Minard (1781-1870); Napoleon's 1812 Russian Campaign; Napoleon; army; temperature; casualty (person); loss; Wikimedia Commons; experimental mathematics; triangle; Evelyn Lamb; Roots of Unity; blog; right triangle; isosceles triangle; integer; edge (geometry); side; length; perimeter; area; algebraic geometry; Inkscape; intermediate; criterion; computer program; source code; data file; height; altitude (triangle); formula; base (geometry); Heron's formula; parameter; semiperimeter; equation; data visualization; SVG image; apex (geometry); calculation; Gnumeric spreadsheet application; triviality (mathematics); algebra; Pythagorean theorem; table (information); pattern; Cartesian coordinate system; graph; bar chart; column chart; aesthetics; aesthetical; reflector (antenna); Yagi-Uda antenna; Yagi antenna; sorting algorithm; sorted; subtraction; difference; average; polar coordinate system; radial; surface (topology); art; artistic; columbidae; dove; mathematics; perspective (graphical); artist; geometry; geometrical; Josef Albers (1888-1976); oil painting; equilateral triangle; John Mccarthy.