Death by Air Pollution
September 16, 2019
For most of our existence,
humanity has had a negligible
environmental impact, since our
population was so small. In
analogy to a
thermal reservoir in
thermodynamics, we could take as much as we wanted from our
environment without depleting its
resources. All this changed at the end of the
Middle Ages, when the world's population began to sharply rise, as the table shows.
Table -
World population estimates from 10000 BC to the present day. The 10000 BC-1925 data from Colin McEvedy and Richard Jones, Atlas of World Population History, Facts on File, (New York, 1978), ISBN 0-7139-1031-3,
sourced from Wikipedia.
| Year |
Millions |
|
Year |
Millions |
| 10000 BC |
4 |
|
1850 |
1,200 |
| 5000 BC |
5 |
|
1900 |
1,625 |
| 2000 BC |
27 |
|
1925 |
2,000 |
| 1000 BC |
50 |
|
1950 |
2,486 |
| 200 BC |
150 |
|
1975 |
4,089 |
| 1 |
170 |
|
2000 |
6,088 |
| 1000 |
265 |
|
2010 |
6,858 |
| 1400 |
350 |
|
2015 |
7,247 |
This trend caught the attention of
English cleric,
Thomas Malthus (1766-1834), in 1798 when he
published An Essay on the Principle of Population at the time when the world population had reached a billion. Malthus saw that an
increased food supply led to population growth, with the increased population requiring even more food. Eventually, the food supply would collapse, causing a
Malthusian catastrophe.
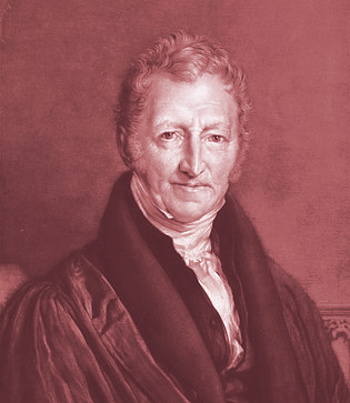
Thomas Malthus (1766-1834) in an 1834 portrait by John Linnell (1792–1882).
(Wikimedia Commons image, modified for artistic effect. Image source is Wellcome Images of the Wellcome Trust, Iconographic Collection 727250i, Photo number: L0069037.)
Although pockets of
famine still exist in the world, a Malthusian catastrophe has not yet happened. The avoidance of such a collapse is principally a consequence of improved
agricultural techniques, including today's advanced techniques of
genetic modification, that have kept pace with the increasing world population. However, we shouldn't be too
complacent, since there are factors, such as
global warming, working against progress in
agriculture. While lack of food has not limited population increase, the rate of population increase has been somewhat dampened by diminished
lifespan caused by
pollution.
Mercury pollution has been a problem since the time of the
Roman Empire, when it was used in the
concentration of
gold and
silver by the
chemical process of
amalgamation.[1] The advent of silver and gold
mining in the
New World caused a release of more than 260,000
tons of
mercury into the environment by 1930.[1] The use of mercury in gold
purification was described by
Georgius Agricola in 1556 in his
De re metallica. Agricola also described the use of another industrial pollutant,
lead, in the
separation of silver from
copper or
iron.
Mercury and lead are
insidious, since they are
toxic at very low concentrations and are usually invisible. After the
Industrial Revolution, however,
air pollution became widespread, and air pollution in the form of
smog is hard to miss (see photograph). Smog contains
sulfur oxides,
nitrogen oxides,
ozone,
smoke and other
particulates that derive from such sources as
coal combustion,
vehicle exhaust,
industrial emissions, and open-air
burning of
agricultural waste.
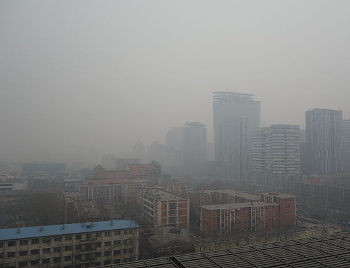
Smog in Beijing, China, as photographed on February 22, 2014.
(Wikimedia Commons image by Kentaro Iemoto. Click for larger image on the Flickr website.)
The
archetypal smog is the dark, yellow-green
pea soup fog associated with
pre-Victorian and
Victorian London.
coal burning from the
17th century onward proved
lethal to
elderly Londoners and those with
respiratory problems, and this smog is even mentioned in the
Sherlock Holmes stories of
Arthur Conan Doyle. A particularly lethal smog affected London in 1952, and this led to
legislation for reduction of
sulfur dioxide emissions and coal smoke.
In 1955 the somewhat
lackluster Air Pollution Control Act was enacted in the
United States, but it was replaced by the more effective
Clean Air Act in 1963, and the additional
Motor Vehicle Air Pollution Control Act in 1965. The US is fortunate in having an
Environmental Protection Agency to protect its
citizens.
A lot has been done to limit air pollution, but much more work remains. A recent study by an international team of
researchers from the
Center for Air, Climate, and Energy Solutions has concluded that air pollution in the United States from 1999 to 2015 is associated with 30,000 deaths and reduced
life expectancy.[2-4] The team, led by
Majid Ezzati of
Imperial College London (London, United Kingdom), included members from
Health Canada (Ottawa, Ontario, Canada),
Brigham Young University (Provo, Utah), the
University of Washington (Seattle, Washington), and the
Harvard T. H. Chan School of Public Health (Boston, Massachusetts). This
research is
published in an
open access article in a recent issue of
PLOS Medicine, and the study was funded by the Environmental Protection Agency and the
Wellcome Trust.[2]
Air pollution in the form of
particulate matter of particle size 2.5
micrometers or less, called PM2.5, is a health hazard.[2] Such particulates, emitted from
power plants,
automobiles, and
factories, can be
inhaled deep into the
lungs, and they are associated with
cardiovascular disease.[3] PM2.5 pollution has been
regulated since 1999, and the study assessed the benefit of such regulation and the present impact of these particulates on health for the population of the
contiguous United States (
Alaska and
Hawaii excluded).[2]
The present PM2.5 standard is 12
micrograms per
cubic meter of
air (μg/m
3).
Fresno County, California, scored the highest value in 1999 at 22.1 μg/m
3.
Tulare County, California, had a reading of 13.2 μg/m
3 in 2015, while
Apache County, Arizona, scored the lowest amount, 2.8 μg/m
3, in that same year.[3] Considerable
modeling was needed in the
analysis of the data, since there are other factors that affect the outcome, such as cumulative
smoking,
mean temperature, and
relative humidity.[2]
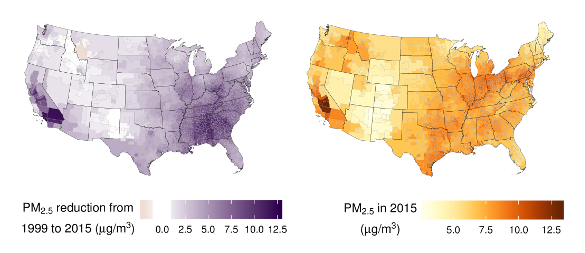
Left, reductions in PM2.5 concentrations from 1999 to 2015. Right, PM2.5 concentrations in 2015. (Portion of fig. 1 from the paper, released on a Creative Commons Attribution License.[2] Click for larger image.)
In the United States, there were 41.9 million deaths from 1999 to 2015, and 18.4 million of these deaths were from from cardiorespiratory disease.[3] The data analysis showed that PM2.5 pollution in excess of 2.8 μg/m
3, the lowest observed concentration, was responsible for an estimated 15,612 deaths in
females and 14,757 deaths in
males.[2-4] These deaths result in a lowered life expectancy of of about seven
weeks for both men and women.[2-4] The life expectancy loss was largest around
Los Angeles and in the
southern states of
Arkansas,
Oklahoma. and
Alabama.
Life expectancy loss was larger in
poorer counties.[2-4] Scientists are always cautious, so the paper states that in
observational studies such as this the associations are not guaranteed to be
causal.[2]
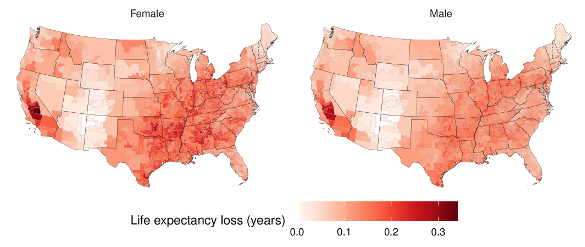
Life expectancy loss in 2015 from fine particulate matter exceeding the observed minimum of 2.8 μg/m3. These values should also correlate with cardiovascular disease in general, so this map highlights one specific area in which I would not want to live. (Portion of fig. 3 from the paper, released on a Creative Commons Attribution License.[2] Click for larger image.)
Says lead
author of the paper, Majid Ezzati,
We've known for some time that these particles can be deadly. This study suggests even at seemingly low concentrations - mostly below current limits - they still cause tens of thousands of deaths. Lowering the PM2.5 standard below the current level is likely to improve the health of the US nation, and reduce health inequality... US PM2.5 concentrations are generally lower than those in many Europe cities - which suggests there may also be substantial number of deaths in Europe associated with air pollution."[3]
Premature deaths due to air pollution in 2010 were about 50% more common in
cities than in
rural areas. This percentage could increase to 90% by 2050, fueled by growth of urban populations and their pollution sources at current rates.[5] As the maps above indicate, some areas of
California are especially plagued by PM2.5 particulates. In order to understand trends of this particulate pollution, a team of scientists from
Lawrence Berkeley National Laboratory and the
University of California, Berkeley, have developed an inexpensive
sensor for
black carbon aerosols, the Aerosol Black Carbon Detector (ABCD), and deployed a hundred of them in a 15
square kilometer area of
West Oakland, California, a community that's surrounded by
freeways and is also affected by industrial emissions and emissions associated with a local
port.[5-6]
The ABCD pulls air through a white
filter that captures black carbon particles, and the amount of
light transmitted through the darkening filter is measured to indicate the degree of particulate pollution. The
materials for each ABCD costs less than $500, while
commercial instruments are much more costly.[6] The devices use
2G cellular signals to transmit their data hourly, and the
database now contains more than twenty million lines of data.[6] The
network of a hundred
sensors, called the 100×100 BC Network, is the largest black carbon monitoring network deployed in a single city.[6]
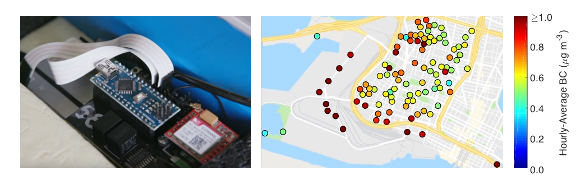
Left image, the Lawrence Berkeley National Laboratory/University of California, Berkeley black carbon aerosol detector. Right image, 8:00 AM weekday readings across West Oakland, California, when the concentrations are the highest. (Left image, from Lawrence Berkeley Laboratory. Right image, a screen capture from a YouTube video. Click for larger image.)
Data taken from May 19, 2017 to August 27, 2017, showed that black carbon concentrations varied sharply over short timespans (∼1 hour) and short distances (∼100 m).[5] There were both
diurnal and weekly cycles that reflected traffic emissions and industrial production.[5-6] black carbon concentrations peaked at the start of business, around eight in the morning (see figure), and the lowest black carbon concentrations were recorded on
Sundays.[6] The
granularity of this network is much finer than that of other monitoring networks, such as those in London and
Hong Kong that have one monitor per 10 square kilometers.[5]
References:
- L. D. Lacerda, "Global mercury emissions from gold and silver mining," Water Air Soil Pollution, vol. 97, no. 3-4 (July, 1997), pp. 209-221, https://doi.org/10.1007/BF02407459.
- James E. Bennett, Helen Tamura-Wicks, Robbie M. Parks, Richard T. Burnett, C. Arden Pope III, Matthew J. Bechle, Julian D. Marshall, Goodarz Danaei, and Majid Ezzati, "Particulate matter air pollution and national and county life expectancy loss in the USA: A spatiotemporal analysis," PLOS, July 23, 2019, https://doi.org/10.1371/journal.pmed.1002856. This is an open access article with a PDF file available here.
- Kate Wighton, "Air pollution in US associated with 30,000 deaths and reduced life expectancy," Imperial College Press Release, July 23, 2019.
- Air pollution in US is associated with mortality and lower life expectancy, PLOS Press Release, July 23, 2019.
- Julien J. Caubel, Troy E. Cados, Chelsea V. Preble, and Thomas W. Kirchstetter, "A Distributed Network of 100 Black Carbon Sensors for 100 Days of Air Quality Monitoring in West Oakland, California," Environ. Sci. Technol., vol. 53, no. 13 (July 2, 2019), pp. 7564-7573, https://doi.org/10.1021/acs.est.9b00282.
- Laurel Kellner, "Making the Invisible Visible: New Sensor Network Reveals Telltale Patterns in Neighborhood Air Quality, Lawrence Berkeley Laboratory Press Release, July 22, 2019.
- New Sensor Network to Monitor Local Air Quality, Berkeley Lab YouTube Video, July 24, 2019.
Linked Keywords: Human; humanity; environmental impact; world population; analogy; thermal reservoir; thermodynamics; environment; natural resource; Middle Ages; World population estimates from 10000 BC to the present day; Wikipedia; English people; clergy; cleric; Thomas Malthus (1766-1834); publishing; published; An Essay on the Principle of Population; food security; food supply; Malthusian catastrophe; portrait; John Linnell (1792–1882); Wikimedia Commons; Wellcome Trust Iconographic Collection 727250i, Photo number: L0069037; famine; green Revolution; agricultural technique; genetically modified organism">genetic modification; complacency; complacent; global warming; agriculture; longevity; lifespan; pollution; mercury (element); Roman Empire; concentration; gold; silver; chemical process; amalgam (chemistry); amalgamation; mining; New World; ton; purification (chemistry); Georgius Agricola; De re metallica; lead; separation of silver; copper; iron; insidious; toxicity; toxic; Industrial Revolution; air pollution; smog; sulfur oxides; nitrogen oxides; ozone; smoke; particulate; coal combustion products; vehicle exhaust; industrial emission; combustion; burning; biomass; agricultural waste; Beijing air pollution, February, 22, 2014; Beijing; China; Kentaro Iemoto; Flickr; archetype; archetypal; pea soup fog; pre-Victorian; Victorian era; London; coal; 17th century; lethality; lethal; old age; elderly; respiratory system; Sherlock Holmes; Arthur Conan Doyle; legislation; sulfur dioxide; lackluster; Air Pollution Control Act; United States; Clean Air Act (United States); Motor Vehicle Air Pollution Control Act; United States Environmental Protection Agency; citizen; research; researcher; Center for Air, Climate, and Energy Solutions; life expectancy; Majid Ezzati; Imperial College London (London, United Kingdom; Health Canada (Ottawa, Ontario, Canada); Brigham Young University (Provo, Utah); University of Washington (Seattle, Washington); Harvard T. H. Chan School of Public Health (Boston, Massachusetts); scientific literature; open-access journal; open access article; PLOS Medicine; particulate matter; micrometer; power station; power plant; automobile; factory; inhalation; inhale; lung; cardiovascular disease; regulation; regulated; contiguous United States; Alaska; Hawaii; microgram; cubic meter; atmosphere of Earth; air; Fresno County, California; Tulare County, California; Apache County, Arizona; mathematical model; modeling; data analysis; smoking; average; mean; temperature; relative humidity; PM2.5 concentrations in the contiguous United States 1999-2015; PM2.5; Creative Commons Attribution License; female; male; week; Los Angeles; southern state; Arkansas; Oklahoma; Alabama; life expectancy; poverty; poor; observational study; causality; causal; correlation; correlate; author; health equity; health inequality; Europe; city; cities; rural area; California; Lawrence Berkeley National Laboratory; University of California, Berkeley; sensor; black carbon; aerosols; square kilometer; West Oakland, California; controlled-access highway; freeway; port; filter paper; transparency and translucency; light transmission; material; commerce; commercial; laboratory equipment; instrument; 2G cellular signal; database; telecommunications network; weekday; YouTube video; diurnal cycle; Sunday; granularity; Hong Kong.