The Wealth of Nations
July 9, 2018
St. Augustine of Hippo (354-430) had a unique explanation of why there is
evil in the world. He reasoned that evil is merely the
absence of good. Until the middle of the
19th century, a
country's well-being wasn't measured by its
monetary wealth, but by the lack of such
social problems as
poverty,
illiteracy,
crime,
disease and early
death.[1] These could be quantified by
life expectancy,
school graduation rate,
welfare rolls, and
prison population.
After about 1850, the perception of a country's wealth shifted away from the
quality of life of its
citizens to
economic indicators. While this shift from counting
smiles to counting
cash did have the effect of better
quantifying the
split between guns and butter, it goes against the
adage that
money can't buy happiness. The usual measure of a country's wealth is its
gross domestic product, the monetary market value of all the final
goods and services produced produced by its people.
In an
earlier article (World Happiness in 2018, April 23, 2018), I wrote about the
Easterlin Paradox that while the
per capita gross domestic product in the
United States has more than doubled since 1972, the happiness of its residents has been roughly stagnant with some declines (see graph). This adds credence to the idea that there are non-monetary determinants of happiness. Studies have shown that once wealth has reached a
subsistence level, the effectiveness of wealth as a generator of well-being is greatly diminished.[2] All this supposes that
happiness can be quantified.
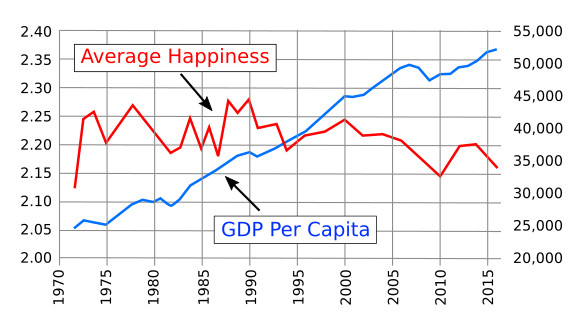
Graph of the Easterlin Paradox. The per capita gross domestic product (GDP) has been increasing since 1972 while happiness (subjective well-being) has been stagnant and in frequent decline. (Data from fig. 7.1 of ref. 2, created using Inkscape. Click for larger image.)
As the variation of GDP between countries shows, the world is not an
economically equitable place. Some countries are constrained by the availability of
natural resources or a defect in their
governance. Notably,
dictatorial regimes appear to stunt the productivity of their nations, while nations in which
businesses are generally free to operate to their selfish advantage within reasonable
legal limits are prosperous. The later
economic model was defended by
economist,
Adam Smith in his 1776 book,
The Wealth of Nations. Smith believed that a
free market operating under the principle of
supply and demand will be
self-regulating and will ensure maximum wealth to its agents. However, it's prudent in today's
technological world that businesses not operate too freely.[3]
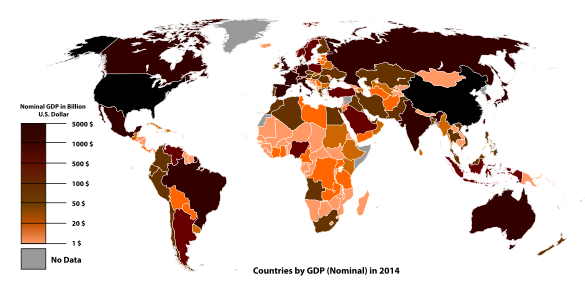
Worldwide gross domestic product (GDP) in 2014. It can be seen that most, but not all, Third World are economically disadvantaged. (Wikipedia Commons image by Ali Zifan. Click for larger image.)
In general, countries monitor their own GDP as a means of
gauging how well they're doing. The problem here is that countries, like people, are always trying to outshine the
competition, so their numbers can be exaggerated. The
Russian adage, "
Trust, but verify," popularized by
US president Ronald Reagan in his dealing with the
Soviet Union, is a good guide in this case; but, is there any easy way that
science can accomplish such verification?
That's the problem tackled by
Luis R. Martinez, a
professor at the
University of Chicago's Harris School of Public Policy. Surprisingly for someone in the field of
public policy, Marinez used
satellite imaging to get a
correlate to a nation's GDP.[4-5] This idea was suggested in a 2012
paper by
economists,
J. Vernon Henderson,
Adam Storeygard, and
David N. Weil, of
Brown University.[6]
The economic prosperity of a country should be correlated with its average
nighttime illumination. While an
agrarian society has wide expanses of
land that are not lighted at night, and nearly all work in agrarian societies is done in
daytime, a technological society has populations concentrated in
urban areas, and it keeps many of its lights on all night. Many
factories operate
24 hours a day in order to make best use of their
capital equipment, and it's
de rigueur for their city streets and
parking lots to be lighted all night.
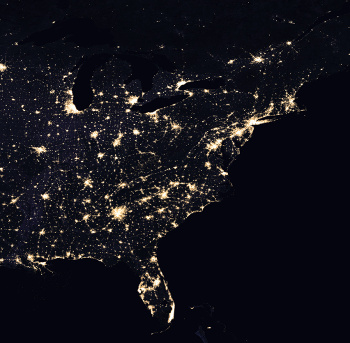
Nighttime image of the Eastern portion of the United States in 2016.
All the large cities and their suburban areas are brightly lighted.
(Portion of the 2016 "Earth at Night" map, NASA Earth Observatory images by Joshua Stevens, using Suomi NPP VIIRS data from Miguel Román, NASA's Goddard Space Flight Center.[7] Click for larger image.)
This satellite data is easy to obtain, since
NASA has published nighttime images of the entire planet on a website. One such image is that of the
Eastern United States shown above.[7-8] NASA's
Miguel Román and his
research team at the
Goddard Space Flight Center (Greenbelt, Maryland) have been processing data from the NASA-
NOAA Suomi National Polar-orbiting Partnership (NPP) satellite to publish night lights imagery.[8] They've been integrating this nighttime imagery into NASA's freely accessible
Global Imagery Browse Services (GIBS) and
Worldview mapping tools that allow access to natural- and
false-color images of Earth within hours of their acquisition by satellites.[8]
Suomi NPP can take images of nearly every location on Earth twice daily, at about 1:30 PM and 1:30 AM,
local time, as it scans the Earth in 3,000
kilometer wide
longitudinal strips from
pole to
pole.[8] Nighttime imagery is not just a "point-and-click" process, since there are quite a few interfering factors, such as the
phase of the Moon,
seasonal vegetation,
clouds,
aerosols,
snow and
ice cover, and
airglow and
aurora atmospheric emissions.[8]
The 2012 Brown University study showed a correlation between the change in nighttime illumination and the change in economic activity, so an increase in nighttime illumination should indicate an increase in the GDP.[5] Note that what was found was the
slope of a curve, and not the curve itself, but they found that the
calculated change in GDP would differ from official values by up to three percentage points
annually.[6] Martinez wanted to see whether
authoritarian regimes were misrepresenting their GDP, thereby causing this
error, and he found that the error was systematically larger the more authoritarian a regime.[4]
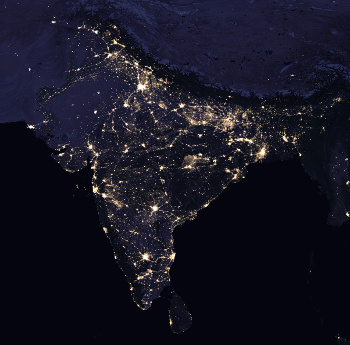
India at night.
India presently has the sixth largest GDP, and it's the world's fastest growing economy, but its per capita gross domestic product is only about $8,000.
(Portion of the 2016 "Earth at Night" map, NASA Earth Observatory images by Joshua Stevens, using Suomi NPP VIIRS data from Miguel Román, NASA's Goddard Space Flight Center.[7] Click for larger image.)
To do such an analysis, you need a
quantitative measure of how authoritarian a country is. Martinez used the
Freedom House score, a classification scheme that scores countries as
free or
not free based on such categories as
civil-rights protections and civil liberties.[5] For high-freedom countries, such as the
United States,
Canada, and those in
Western Europe, a 10% lighting increase correlated with about a 2.4 percent increase in GDP.[4-5] Countries scored as less free reported larger GDP gains for the same percentage change in lighting, and the most authoritarian countries claimed huge annual GDP changes relative to the freest countries for the same increase in nighttime illumination.[5] Martinez found that the annual GDP growth rates of the most authoritarian countries,
China and
Russia, are inflated by a factor of between 1.15 and 1.3.[4] This effect was most notable when the authoritarian countries were nearing an
election.[5]
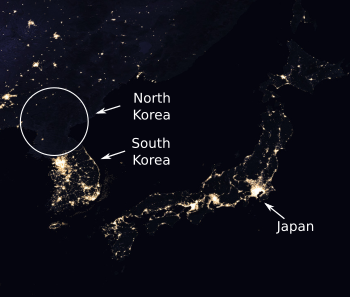
Nighttime lighting for Japan, and for North Korea and South Korea.
North Korea is essentially invisible at night, a testament to its very poor economy.
(Portion of the 2016 "Earth at Night" map, NASA Earth Observatory images by Joshua Stevens, using Suomi NPP VIIRS data from Miguel Román, NASA's Goddard Space Flight Center.)[7]
(Image labeled using Inkscape. Click for larger image.)
Martinez examined whether his findings could be explained by differences in economic structure, statistical capacity, or rates of
urbanization or
electrification, but he could find no evidence for this.[4] The data show a stronger
incentive for governments to exaggerate economic performance as a response to low economic growth, upcoming elections or after an ineligibility for
foreign aid.[4] The presence of independent economic institutions, such as a
central bank that sets a country's
monetary policy, tends to reduce these exaggerations.[5]
References:
- Eli Cook, "How Money Became the Measure of Everything," The Atlantic, October 19, 2017.
- Richard A. Easterlin, "Explaining happiness," Proc. Natl. Acad. Sci., vol. 100, no. 19 (September 16, 2003), pp. 11176-11183, https://doi.org/10.1073/pnas.1633144100.
- Emissions of an ozone-destroying chemical are rising again, National Oceanic and Atmospheric Administration Press Release, May 16, 2018.
- Luis R. Martinez, "How Much Should We Trust the Dictator's GDP Estimates?" SSRN, May 1, 2018, http://dx.doi.org/10.2139/ssrn.3093296.
- Satellite data strongly suggest that China, Russia, and other authoritarian countries are fudging their GDP reports, philly.com, May 15, 2018.
- J. Vernon Henderson, Adam Storeygard, and David N. Weil, "Measuring Economic Growth from Outer Space," American Economic Review, vol. 102, no. 2 (April 2012), pp. 994-1028.
- 2016 "Earth at Night" map, 8 MB *.jpg file, NASA Earth Observatory images by Joshua Stevens, using Suomi NPP VIIRS data from Miguel Román, NASA's Goddard Space Flight Center.
- Michael Carlowicz, "New Night Lights Maps Open Up Possible Real-Time Applications, NASA Earth Observatory, April 12, 2017.
Linked Keywords: St. Augustine of Hippo (354-430); evil; absence of good; 19th century; country; monetary; wealth; society; social; poverty; literacy; illiteracy; crime; disease; death; life expectancy; school graduation; welfare; prison; quality of life; citizenship; citizen; economic indicator; smile; cash; quantification; quantify; guns versus butter model; adage; money can't buy happiness; gross domestic product; goods and services; Easterlin Paradox; per capita; United States; living wage; subsistence level; happiness economics; happiness can be quantified; Cartesian coordinate system; graph; per capita gross domestic product; happiness; Inkscape; equity (economics); economically equitable; natural resources; government; governance; dictatorship; dictatorial regime; business; law; legal limit; economic model; economist; Adam Smith; The Wealth of Nations; free market; supply and demand; self-regulatory organization; self-regulating; technology; technological; Third World; economics; Wikipedia Commons; Ali Zifan; measurement; gauging; competition; Russian language; Trust, but verify; US president; Ronald Reagan; Soviet Union; science; Luis R. Martinez; professor; University of Chicago; Harris School of Public Policy; public policy; satellite imagery; satellite imaging; correlation and dependence; correlate; academic publishing; paper; J. Vernon Henderson; Adam Storeygard; David N. Weil; Brown University; night; nighttime; street light; illumination; agrarian society; agricultural land; daytime; urban area; factory; 24 hours a day; capital cost; capital equipment; de rigueur; parking lot; eastern portion of the United States; suburb; suburban; Joshua Stevens; Miguel Román; Goddard Space Flight Center; NASA; Eastern United States; research; National Oceanic and Atmospheric Administration; NOAA; Suomi National Polar-orbiting Partnership (NPP) satellite; Global Imagery Browse Services (GIBS); Worldview; false-color; local time; kilometer; longitude; longitudinal; antarctic; arctic; pole; lunar phase; phase of the Moon; season; seasonal; vegetation; cloud; aerosol; snow; ice; airglow; aurora; atmosphere of Earth; atmospheric; emission spectrum; slope of a curve; calculation; calculated; annual; authoritarianism; authoritarian regime; errors and residuals in statistics; India; economy of India; sixth largest GDP; per capita; quantification; quantitative; Freedom House; civil and political rights; civil-rights protections and civil liberties; United States; Canada; Western Europe; China; Russia; election; Japan; North Korea; South Korea; Inkscape; urbanization; electrification; incentive; foreign aid; central bank; monetary policy.