Science and Engineering Employment
September 2, 2013
The
STEM fields (
science,
technology,
engineering and
mathematics) are specialized occupations, so it's not always possible to find your first, or next, job where you presently live. For a
known reason, half the members of the
American Mathematical Society relocate to the
Washington, D.C., area. The rest of us end up dispersed across the country.

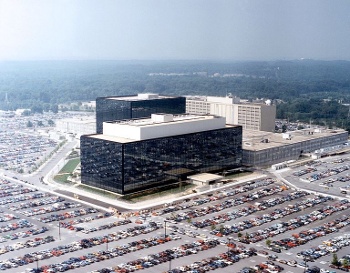
Headquarters of the US National Security Agency (NSA) at Fort Meade, Maryland.
The NSA is the largest employer of mathematicians in the United States, but it can hire only U.S. citizens.
(Via Wikimedia Commons.)
My wife and I enjoyed living in
Pittsburgh during my
post-doctoral years at the
University of Pittsburgh, but my first "real" job took us 350
miles east to
Northern New Jersey. It could have been worse, since I had overtures at another
research location 1,600 miles to the west. Since my wife and I originated in the
Northeast,
New Jersey was a comfortable choice.
The
National Science Foundation has just published
statistics on the regional concentrations of
scientists and
engineers in the
United States.[1] As an undifferentiated group, we're rather
uniformly distributed among the
states, although it's understandable that some specialties (e.g.,
oceanography) might be concentrated along the
seacoasts. There would also be hot spots for
experimental high energy physics.
The NSF employment estimate was derived from
US Census Bureau data for 2011. According to the NSF estimates, there are 5,677,410 ± 37,585 scientists and engineers in the United States. Since the
US population stands at about 315 million, this means that employed scientists and engineers are less than 2% of the total population. When you consider the percentage among the working population, it's 4.1%.[1]

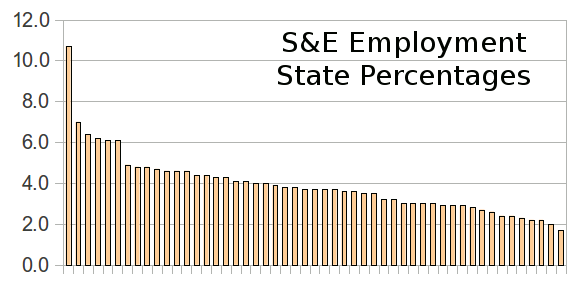
Science and engineering employment as a percentage by state, with Washington DC, the largest employer (10.7%), included. The smallest percentage (1.7%) is Mississippi. A CSV file of these data can be found here. (Data from the NSF report.)[1)]
The following table lists the top ten states in terms of percentage science and engineering employment.[1]
One thing that always amazed me was the small number of my
colleagues who were members of
professional societies. As you can see, the membership numbers of these representative organizations below fall far short of five and a half million scientists and engineers.
Not surprisingly, some
urban areas have a high concentration of science and engineering talent.
Santa Clara,
Los Angeles,
San Diego, the
New York metropolitan area,
Denver and
Houston, accounted for 13% of science and engineering workers.[1] Nationwide, there were 3.1 million employed in
computer or
mathematical sciences occupation, and there were 1.7 million engineers. Of the remainder, 259,000 were in
biological,
agricultural, and
environmental sciences, 368,000 in
physical sciences, and 285,000 in
social sciences.[1] Social sciences would not have been included in my definition of science and engineering.
One quarter of people employed in science and engineering lived in the three most populous states; namely,
California,
Texas, and
New York. Adding in
Florida,
Virginia,
Pennsylvania,
Illinois,
Massachusetts and
Ohio accounted for fully half. Most states had a lower science and engineering employment intensity than the United States as a whole, which means that the
median was remote from the
mean.[1]
Fifteen percent of approximately 3 million computer and mathematical sciences employees were concentrated in the New York metropolitan area, Santa Clara, Los Angeles,
Denver,
Fairfax County, Virginia, the District of Columbia, and Houston.[1] Ten percent of the approximately two million engineers lived in Santa Clara, Houston, Los Angeles and San Diego.[1]
The New York metropolitan area, San Diego, Los Angeles,
Boston and
Montgomery County, Maryland, employed 14% of the 259,000 life science workers. The physical sciences were concentrated in Los Angeles, San Diego, Santa Clara,
Oakland, Denver, Boston, Houston, and Montgomery County, Maryland. Seventeen percent of the nationwide total of 368,000 of physical scientists lived in these areas.[1]
There are 285,000
social scientists nationwide. I'm not surprised that thirteen percent of these live in the District of Columbia, Los Angeles, and New York City.[1]

Social science in a different age.
The Works Progress Administration (WPA) was a depression-era government agency designed to create employment.
The WPA also funded musicians, artists, writers and actors.
(United States Library of Congress image cph.3b49400, via Wikimedia Commons.)
![]()
References:
- Beethika Khan and Jaquelina Falkenheim, "Regional Concentrations of Scientists and Engineers in the United States," NSF Report No. NSF 13-330 (August 2013), Science and Engineering Indicators Program, National Center for Science and Engineering Statistics, National Science Foundation.
- Official 2013 Unit Membership Statistics, American Physical Society.
- Jamie Moesch, "IEEE Membership Tops 429 000," The Institute, March 8, 2013.
- American Chemical Society, Council Agenda, August 22, 2012.
- American Mathematical Society 2011-2012 Annual Report.
- ACM's Annual Report (2012), Association for Computing Machinery.
Permanent Link to this article
Linked Keywords: STEM fields; science; technology; engineering; mathematics; American Mathematical Society; Washington, D.C.; National Security Agency; Fort Meade, Maryland; mathematician; citizenship in the United States; U.S. citizen; Wikimedia Commons; Pittsburgh; postdoctoral research; University of Pittsburgh; mile; North Jersey; Northern New Jersey; research; Northeastern United States; Northeast; New Jersey; National Science Foundation; statistics; scientist; engineer; United States; uniform distribution; uniformly distributed; U.S. state; oceanography; seacoast; experiment; experimental; particle physics; high energy physics; United States Census Bureau; data; demographics of the United States; US population; Washington DC; Mississippi; comma-separated values; CSV file; NSF report; District of Columbia; Maryland; >Massachusetts; Virginia; Colorado; Washington State; California; New Hampshire; New Jersey; Delaware; collegiality; colleague; professional association; professional society; American Physical Society; Institute of Electrical and Electronics Engineers; American Chemical Society; American Mathematical Society; Association for Computing Machinery; urban area; Santa Clara; Los Angeles; San Diego; New York metropolitan area; Denver; Houston; computer science; mathematical sciences; biology; biological; agriculture; agricultural; environmental science; physical sciences; social sciences; California; Texas; New York; Florida; Virginia; Pennsylvania; Illinois; Massachusetts; Ohio; median; mean; Denver; Fairfax County, Virginia; Boston; Montgomery County, Maryland; Oakland; social scientist; Works Progress Administration; Great Depression; Beethika Khan and Jaquelina Falkenheim, "Regional Concentrations of Scientists and Engineers in the United States," NSF Report No. NSF 13-330 (August 2013), Science and Engineering Indicators Program, National Center for Science and Engineering Statistics, National Science Foundation.