Numb3rs
June 6, 2012
Scientists love
numbers. Most of these numbers are the
data generated by
experiments. In the early days of science, these were handwritten into
notebooks, so there weren't that many. Even then, such data were summarized in
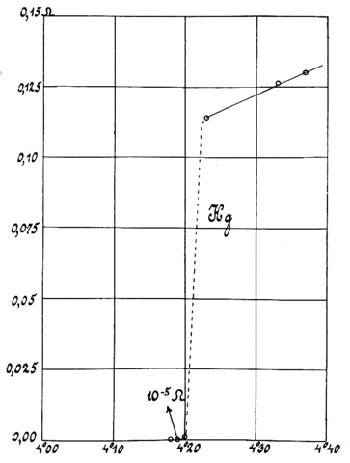
plots to make them understood. From a plot you could see that as the
temperature decreases, the
resistance of
mercury decreases
linearly until a
critical point is reached (see figure).

Heike Kamerlingh Onnes' 1911 data plot of the superconductivity of mercury.
The Cartesian coordinate system, invented by the French mathematician, René Descartes, is something scientists use nearly every day, but we forget how important an invention this is.
(Via Wikimedia Commons))
Today, such summaries are more important than ever, since
computers and automated
data acquisition devices have drowned us in a sea of data. In the past, we used to join the data points on graphs by lines; now, the data points are so dense that they form their own line. This vast sea of data allows one other feature that was hard to justify in older experiments. We can make
statistical inferences about what's happening to generate
theories bereft of their usual
axioms and
analysis.
We don't need to limit these theories to gas molecules, or elementary particles. Much can be learned about human behavior through theory-building and statistical inference. This is the premise of the popular television series,
Numb3rs, which ran from 2005-2010, in which the physicist brother of an FBI agent uses physical theory, mathematics and computer science to solve crimes.[1] It was the
Murder, She Wrote for the
computer age.[2]
One simple example of using
data mining in the study of the evolution of concepts is the trend in the use of the phrase, "
basic research," in articles published in
The New York Times that I mentioned in a
previous article (Basic Research, October 22, 2010).[3] It's possible to perform such an analysis for concepts of the past decade using
Google Trends, as the example below shows.

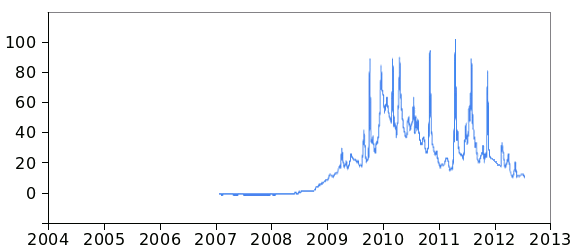
Relative occurrence of "Lady Gaga" in US news reports. From these data, I can safely conclude that Lady Gaga hit the scene in the third quarter of 2008. Data from Google Trends, rendered via Gnumeric)
This same idea was amplified considerably by scientists at
Harvard University in their development of
Culturomics, an analysis of the words collected by
Google in the course of its
Google Books project. I reviewed Culturomics in a
previous article (Culturomics, January 13, 2011). The project has its own web site,
www.culturomics.org.
The project looks for trends similar to the one in the figure, above, using not just words in news sources in the past decade, but rather 500 billion words, collected from 5,195,769 books. This enormous number is just a fraction scanned by Google. With this database, it's possible to assess
word frequency over the course of centuries. An example of the trend for the word, "
Atlantis," can be found
here.
It's possible to go beyond word frequency in data mining.
Remote sensing of the
Earth via
satellite is one common example of extracting information from images, but a recent study has looked at how satellite imagery can pinpoint affluent neighborhoods in
cities.
The
hypothesis is that
trees, since they are a decorative feature, would be more abundant in affluent areas that can best afford them. Affluent property owners can afford more land, so more of it can be devoted to planting, rather than structures. Also, cities with a better
tax base can plant and maintain more trees.[5]
This
correlation of income with tree
density appears to be valid. Each percent increase in
per capita income, increased tree cover by 1.76 percent; and, each decrease of per capita income by one percent decreased tree cover by 1.26 percent.[5] I think this would only apply to cities, since the
suburbs where I live are filled with trees, and most of us don't feel all that rich.
One recent
statistical study, presented in the
SIAM Journal on Mathematical Analysis, resembles the crime modeling premise of the Numb3rs television series that I mentioned earlier. It will surprise no one that urban crimes happen in the same places and at the same time of day.
Burglaries are more likely to occur again for houses burglarized before, or close to others that have been burglarized. This finding allows the identification of burglary hotspots.[6-7]

Neighborhood Watch
When I was a student, I lived in an apartment in what might be categorized as a "bad neighborhood," although "bad" in those days was mild compared with today's definition.
(US Department of the Interior, US Geological Survey photo, via Wikimedia Commons)
The authors of the SIAM paper propose a
mathematical model to describe these hotspots. One measure used is the "attractiveness value" of a burglary target. This is the
trade-off between how valuable the target home is, versus the chances of getting caught. When a house has been burglarized before, the attractiveness value of that house, as well as adjacent houses, increases.
Criminals tend to operate in areas of high attractiveness. This follows the conventional wisdom of the "
broken window effect," in which homes burglarized before will be burglarized again.[6-7]
As befits an eighteen page paper in such a journal, the
mathematics is quite dense. The modeling is based on
bifurcation theory, which involves
ordinary differential equations under varying conditions. In this case, the variable conditions are the social and
economic conditions of a neighborhood. This research was supported by the
National Science Foundation.[6]
References:
- "Numb3rs" on the Internet Movie Database.
- "Murder, She Wrote" on the Internet Movie Database.
- Jean-Baptiste Michel, Yuan Kui Shen, Aviva Presser Aiden, Adrian Veres, Matthew K. Gray, The Google Books Team, Joseph P. Pickett, Dale Hoiberg, Dan Clancy, Peter Norvig, Jon Orwant, Steven Pinker, Martin A. Nowak, and Erez Lieberman Aiden, "Quantitative Analysis of Culture Using Millions of Digitized Books," Science, vol. 331, no. 6014 (January 14, 2011), pp. 176-182.
- Steve Bradt, "Oh, the humanity - Harvard, Google researchers use digitized books as a 'cultural genome'," Harvard University News Release, December 16, 2010.
- Maggie Koerth-Baker, "Income inequality can be seen from space," BoingBoing, June 1, 2012.
- Predicting burglary patterns through math modeling of crime, Society for Industrial and Applied Mathematics Press Release, June 1, 2012.
- Robert Stephen Cantrell, Chris Cosner, and Raúl Manásevich, "Global Bifurcation of Solutions for Crime Modeling Equations," SIAM Journal on Mathematical Analysis, vol. 44, no. 3 (May-June, 2012) pp. 1340-1358.
Permanent Link to this article
Linked Keywords: Scientists; number; data; experiment; notebook; plot; temperature; resistance; mercury; linear function; linear; critical point; Heike Kamerlingh Onnes; superconductivity; Cartesian coordinate system; French; mathematician; René Descartes; Wikimedia Commons; computer; data acquisition; statistical inference; theory; axiom; analysis; Numb3rs; Murder, She Wrote; computer age; data mining; basic research; The New York Times; Google Trends; Lady Gaga; Gnumeric; Harvard University; Culturomics; Google; Google Books; www.culturomics.org; word frequency; Atlantis; remote sensing; Earth; satellite; city; cities; hypothesis; tree; tax base; correlation; density; per capita income; suburb; statistics; statistical; Society for Industrial and Applied Mathematics; SIAM Journal on Mathematical Analysis; burglary; burglaries; Neighborhood Watch; undergraduate student; apartment; US Department of the Interior; US Geological Survey; mathematical model; trade-off; crime; criminal; broken window effect; mathematics; bifurcation theory; ordinary differential equations; economy; economics; National Science Foundation; Internet Movie Database.